Dynamic Risk Range shows a live estimate of how price maps to risk right now. The table recalculates from the latest market price and recent risk history. That means the price levels are not fixed targets. They can move as market conditions change. Use it to understand the current relationship between price and risk: what prices are closer to cooler risk zones, neutral zones, or hotter risk zones based on the latest model snapshot.
How to use the Dynamic Risk Range?
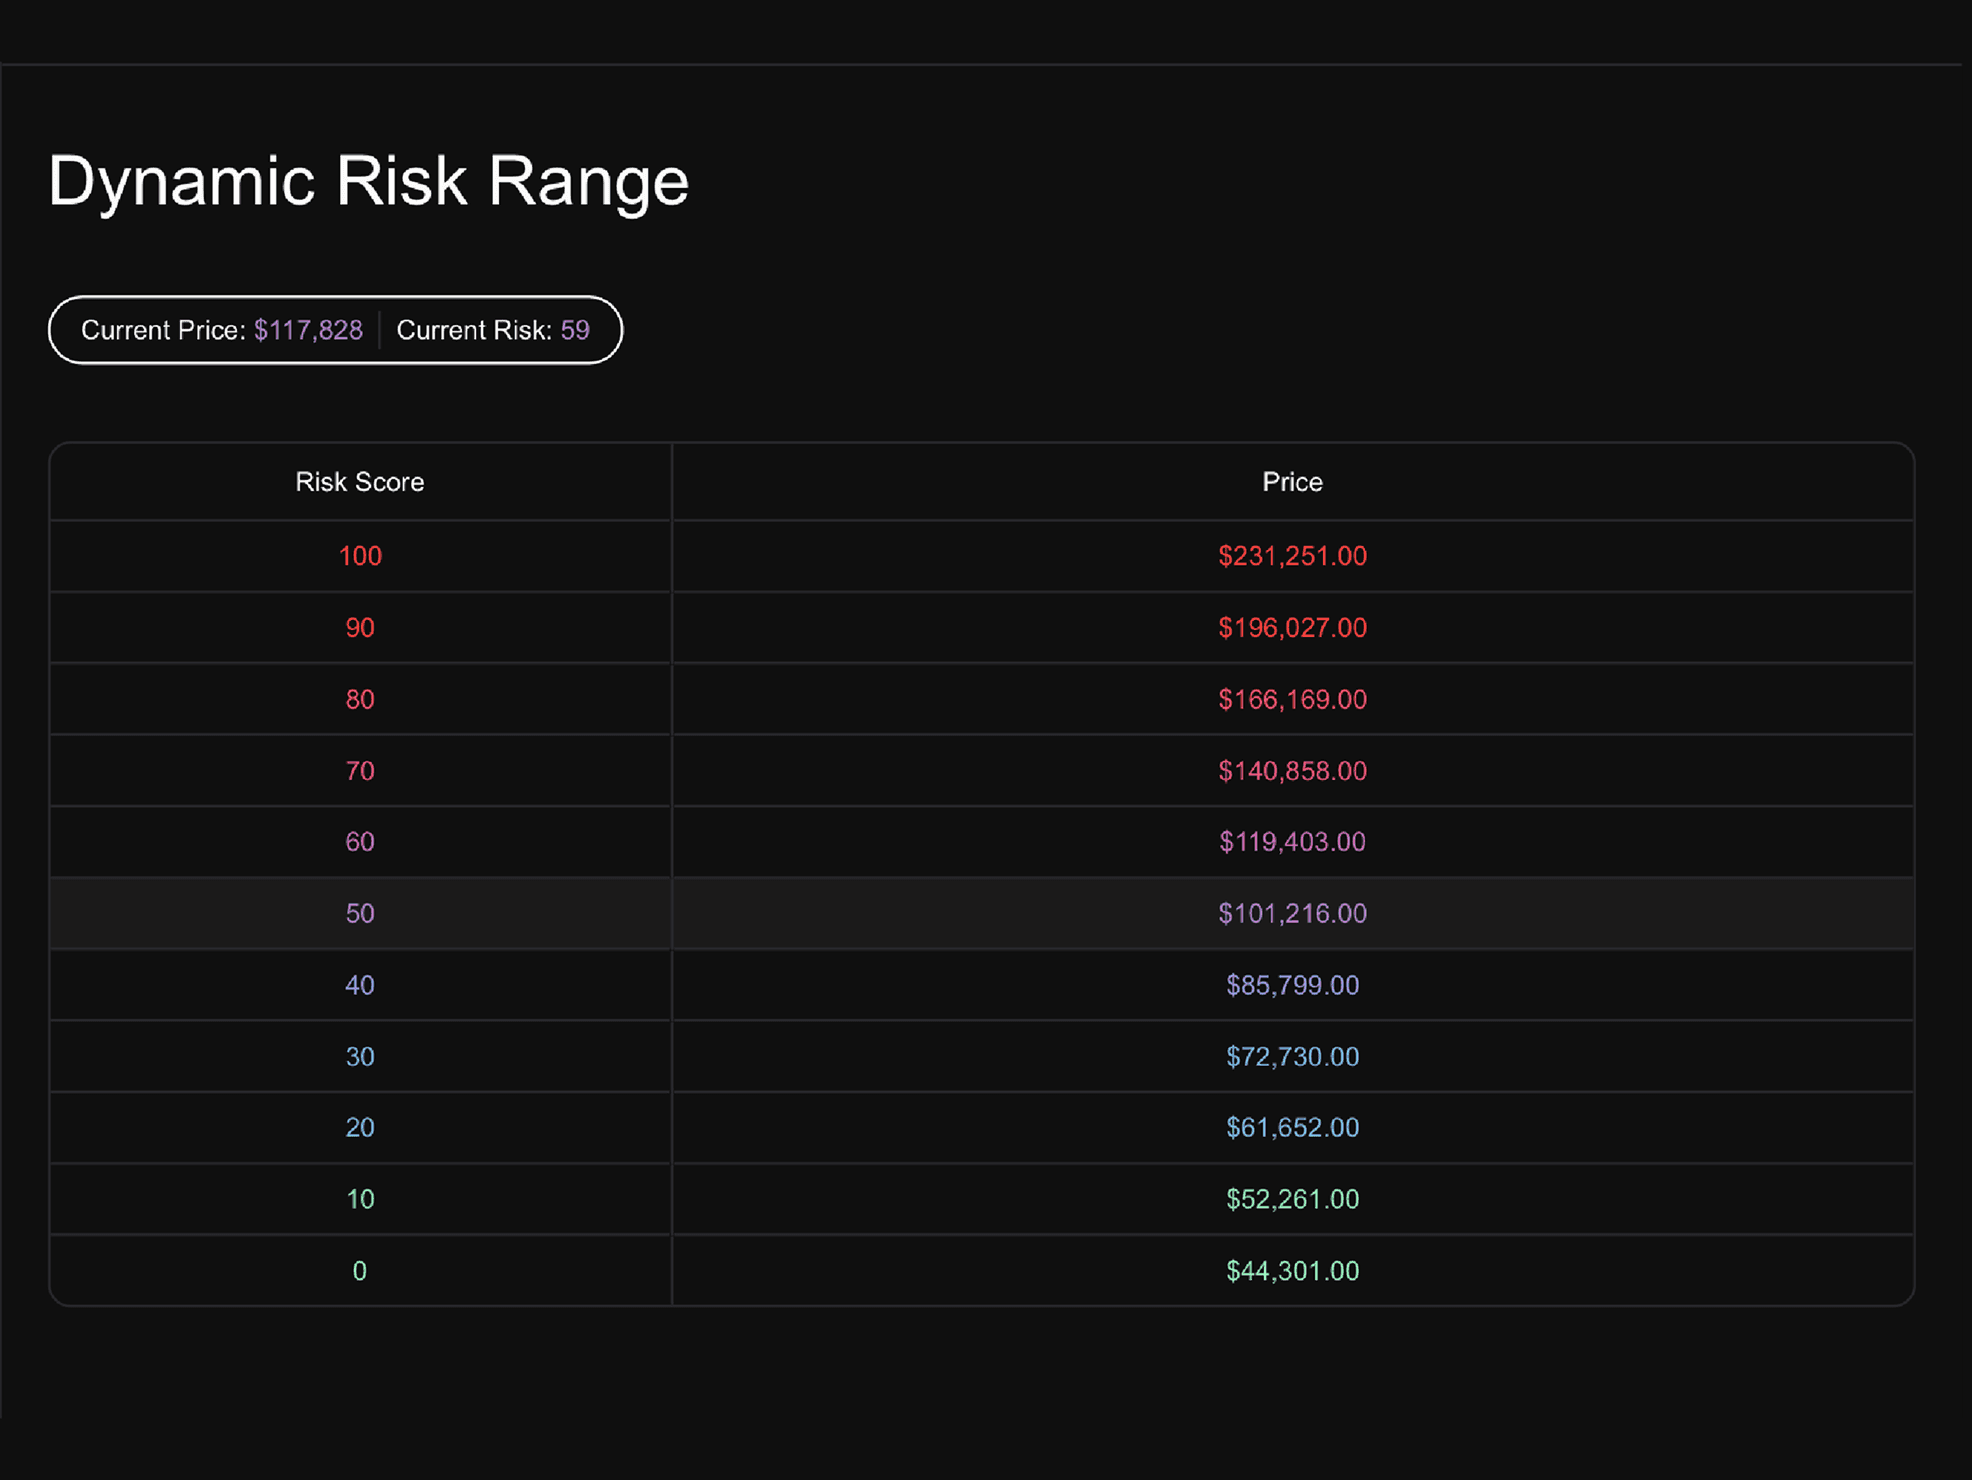
Start with the current price and current risk. Then compare nearby rows to see how price changes may shift the asset into a different risk zone.
- Lower rows show cooler risk areas based on the current model.
- Middle rows show more neutral risk areas.
- Higher rows show hotter risk areas.