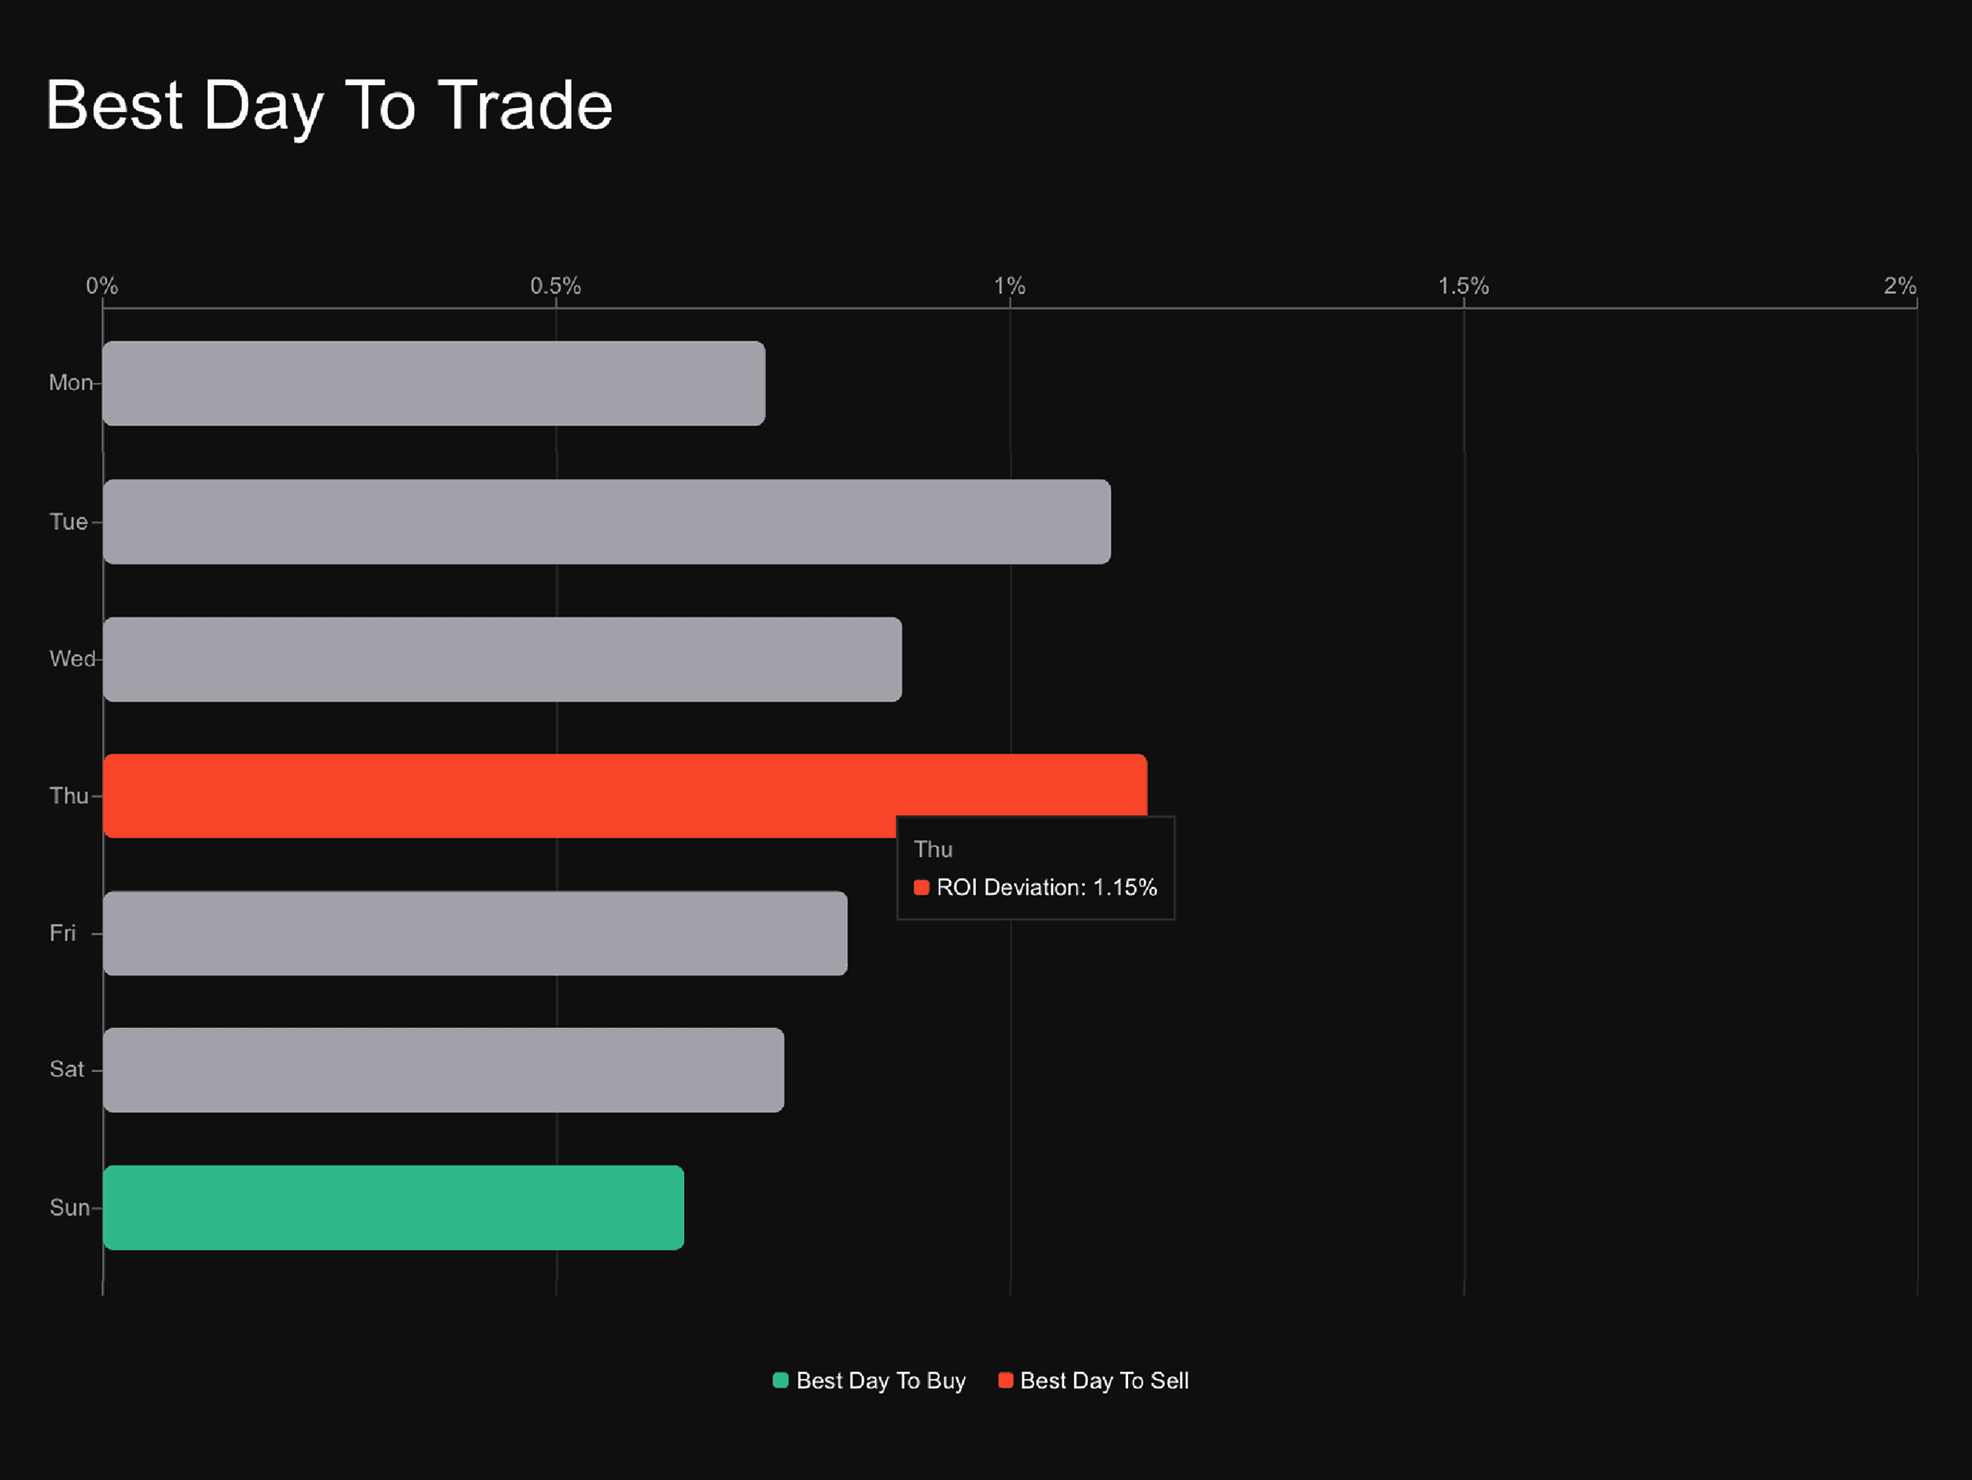
Calendar Performance shows whether each weekday or calendar date has historically traded above or below its recent moving average.
Each value is the average percent distance from trend for that calendar slot.
How to read Calendar Performance?
Use it to compare calendar slots before choosing a recurring plan schedule:
- Below trend means the asset was usually priced under its recent moving average on that day.
- Above trend means the asset was usually priced over its recent moving average on that day.
- Stronger color means the average distance from trend was larger.
Use Calendar Performance as timing context for a recurring plan, not as a prediction.