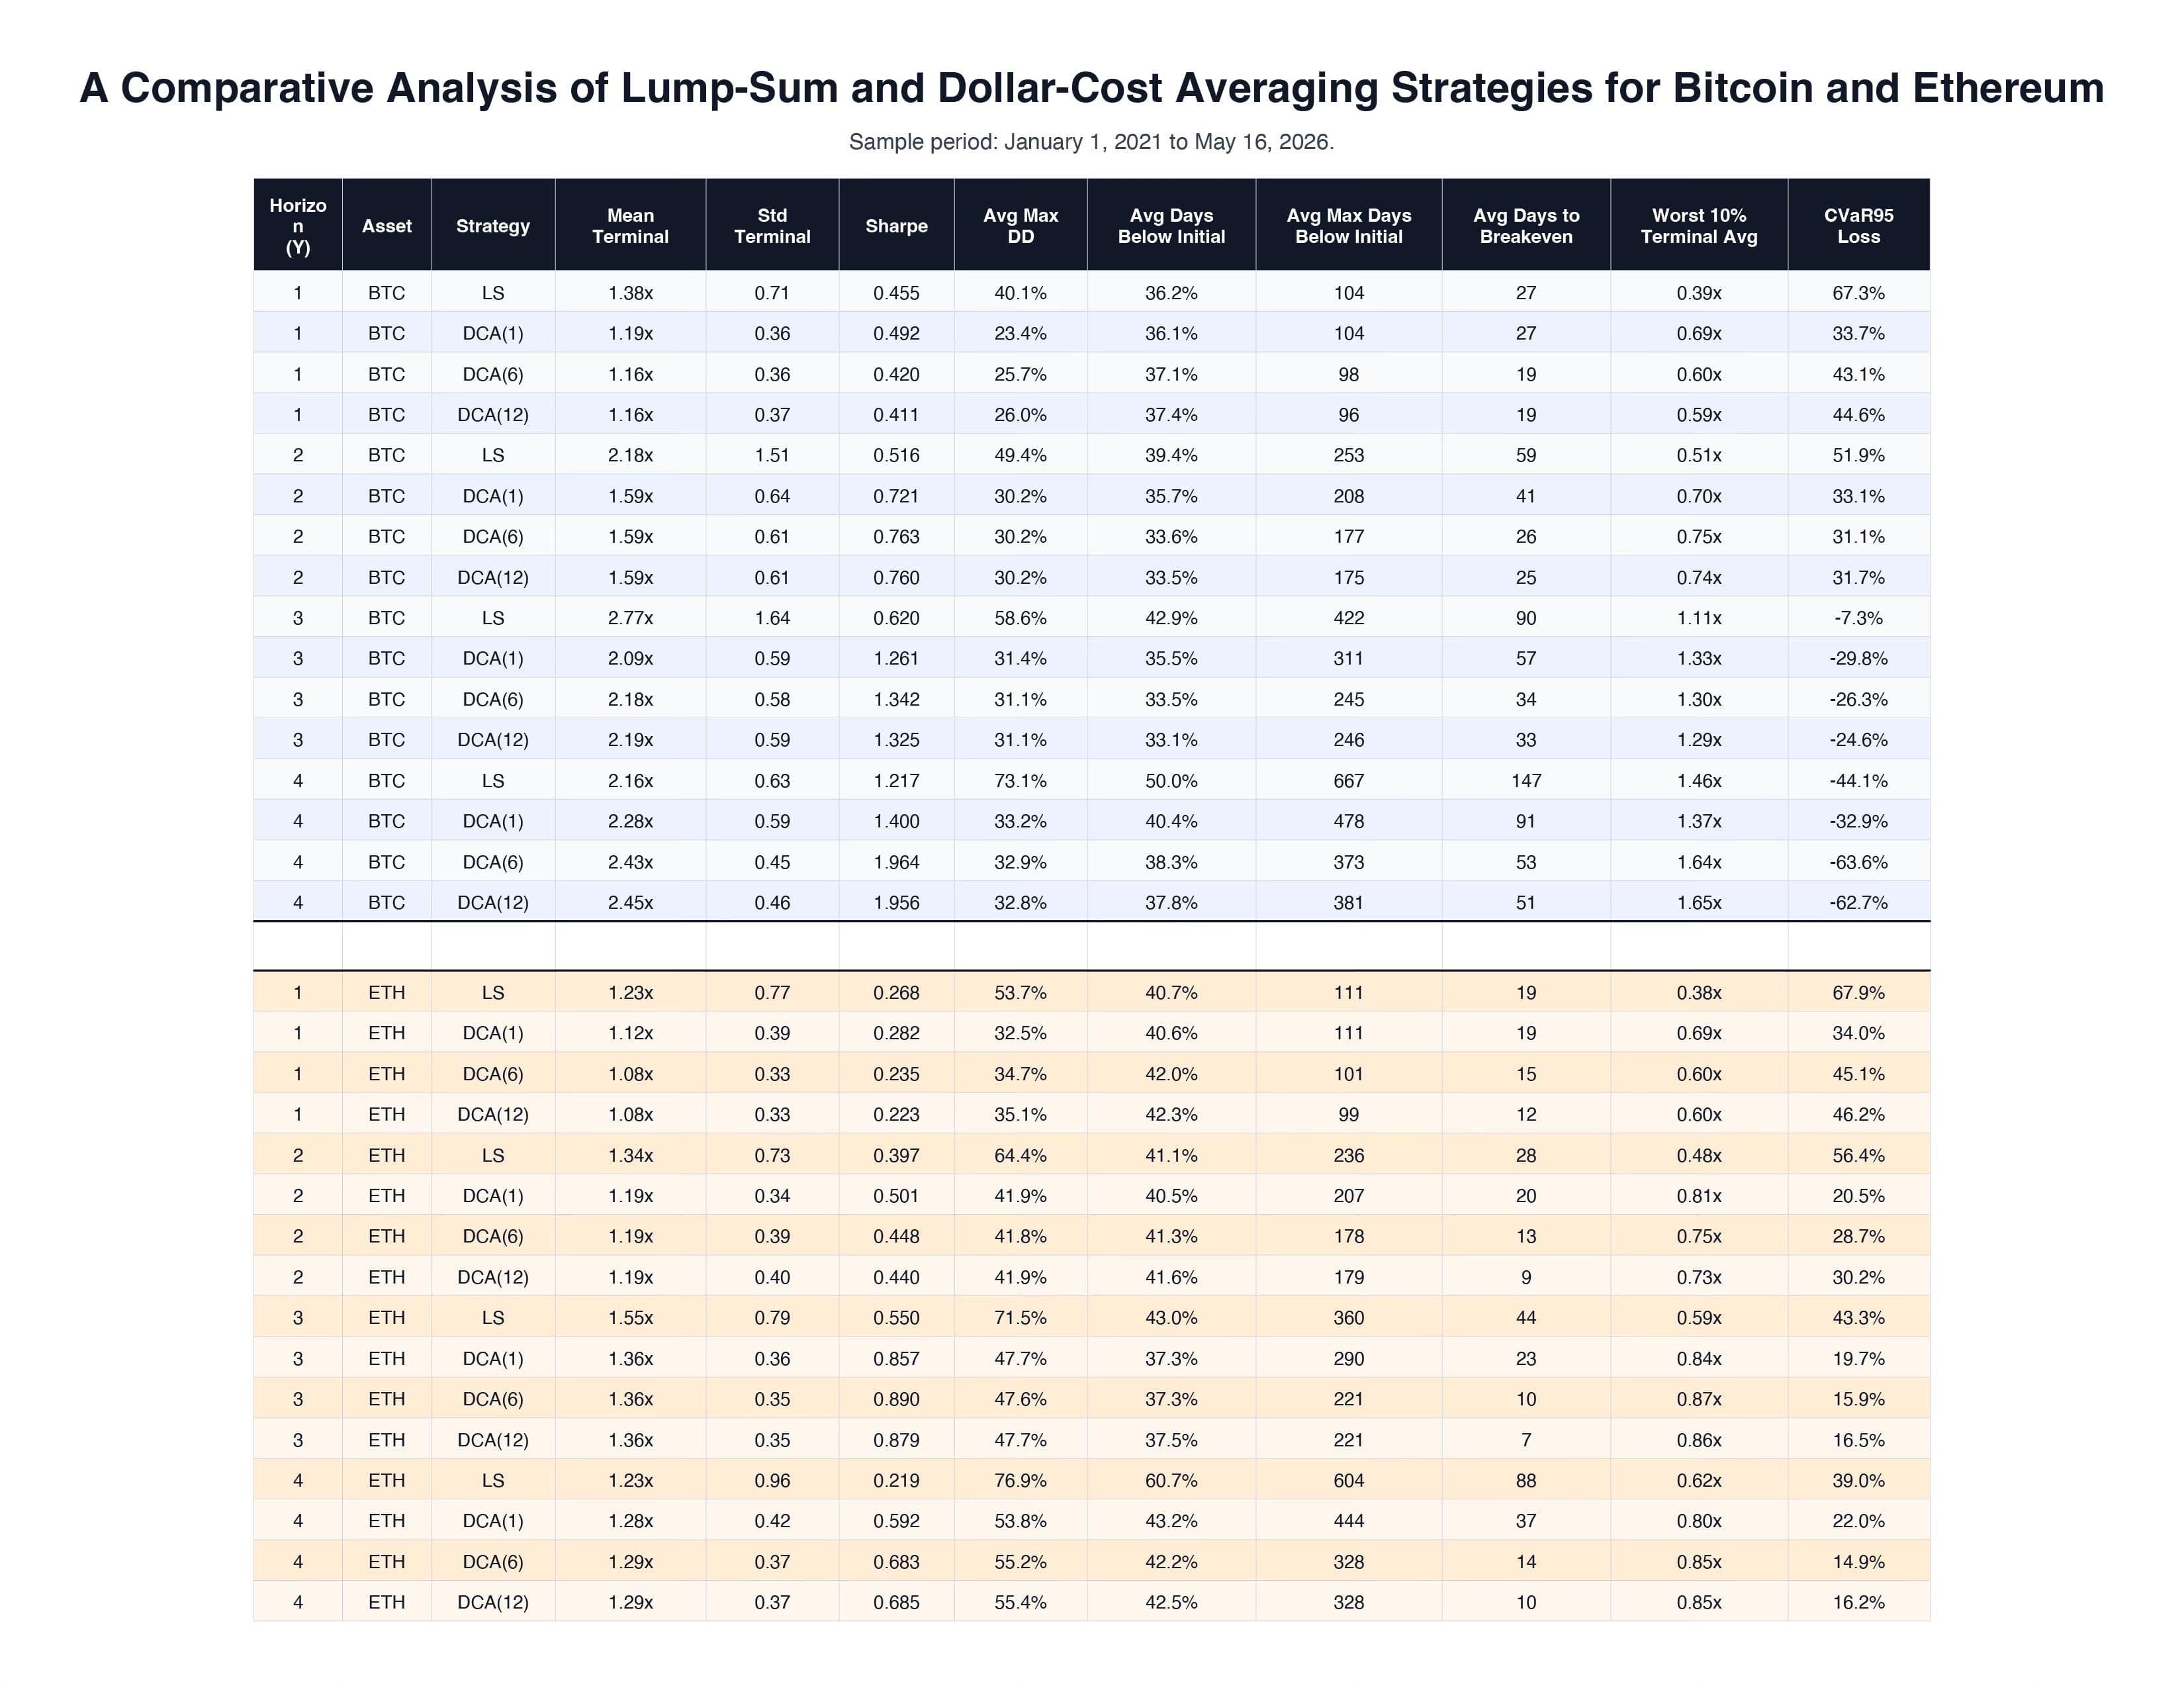
Here the test result:
Strategies tested:
LS = invest all capital immediately
DCA(1) = split investment over yearly intervals
DCA(6) = split investment over 6 periods per year
DCA(12) = monthly DCA
How to read the table:
Mean Terminal = average final portfolio value. Higher is better.
Std Terminal = how spread out the final outcomes are. Higher means more uncertainty around the result.
Sharpe = return per unit of volatility. Higher is better.
Avg Max DD = average maximum drawdown. Lower is better.
Avg Days Below Initial = average percent of time the strategy stayed below the starting capital. Lower is better.
Avg Max Days Below Initial = average longest stretch spent below starting capital. Lower is better.
Avg Days to Breakeven = average time needed to recover back to starting capital after falling below it. Lower is better.
Worst 10% Terminal Avg = average final result from the worst 10% of starting periods. Higher is better.
CVaR95 Loss = average loss in the worst 5% of outcomes. Lower is better.
Key takeaway:
LS wins big on return for both BTC and ETH
LS generally fails on remaining metrics, except for Avg Days Below Initial
More frequent DCA is not always better.
Question:
“Do we need an accumulation strategy that improves long-run survivability without giving up too much return?”
Deeper analysis coming…