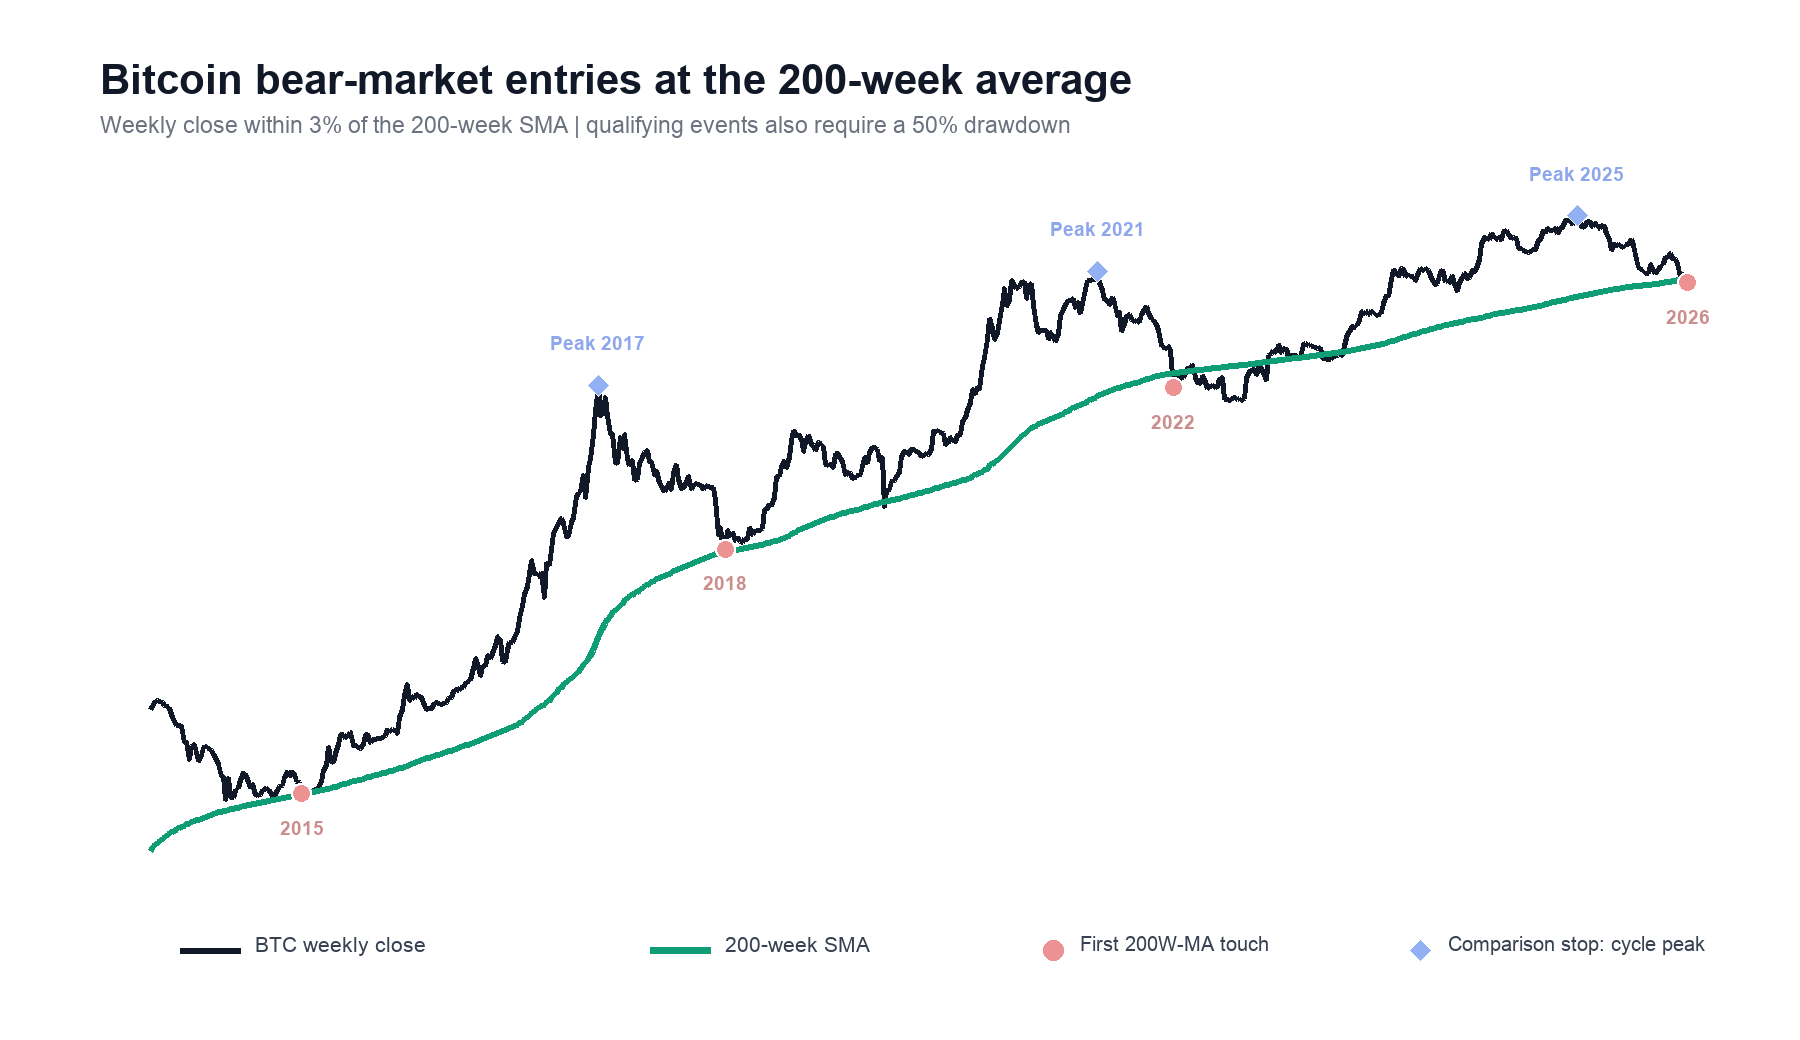
Bitcoin recently returned to a level long-term investors watch closely. On June 28, 2026, Bitcoin weekly closed around $59,490, under the 200 Week Moving Average (200WMA). At that time the 200WMA was approximately $62,302, while Bitcoin remained 51.77% below its previous all-time high.
This analysis compares weekly Adaptive Accumulate (AA) with fixed $100 weekly Dollar-Cost-Averaging (DCA) during Bitcoin’s late-bear-market. Both strategies invest the same total amount, allowing the comparison to focus entirely on purchase timing and position sizing.
* Adaptive Accumulate (AA): Buy dynamic amount ($) based on the asset Risk Score.
* Dollar-Cost-Averaging (DCA): Buy an equal amount ($) on the same schedule.
Result: Across all three completed cycles, AA accumulated more BTC compared to DCA:
2015 cycle: 36.15% more BTC
2018 cycle: 21.76% more BTC
2022 cycle: 22.26% more BTC
AA achieved these results by investing less during higher-risk weeks and more during lower-risk weeks. The following analysis explains how each cycle was selected, how the investment amounts were normalized, how the advantage developed over time, and what the results may mean for the current 2026 cycle.
1. Test frame: Late-Bear-Market
A cycle begins at the first weekly close that meets all four conditions:
Drawdown: Bitcoin is at least 50% below its previous all-time high.
200W SMA touch: The weekly close is within 3% above the 200-week SMA or below it.
Separation: Bitcoin spent at least 26 prior weeks above the touch zone.
Reset: Bitcoin established a new all-time high since the previous cycle.
This identified first-touch signals in 2015, 2018, 2022, and 2026. The March 2020 Covid pandemic crash was a repeat touch within the 2018 cycle, so it was excluded. The 2026 cycle remains incomplete.
2. DCA vs. AA Setup
The Rules:
Fixed DCA bought exactly $100 every Friday. Fixed DCA determines the total budget for each cycle:
Cycle budget = Number of Fridays x $100
Adaptive used Hodly’s Risk Metric:,
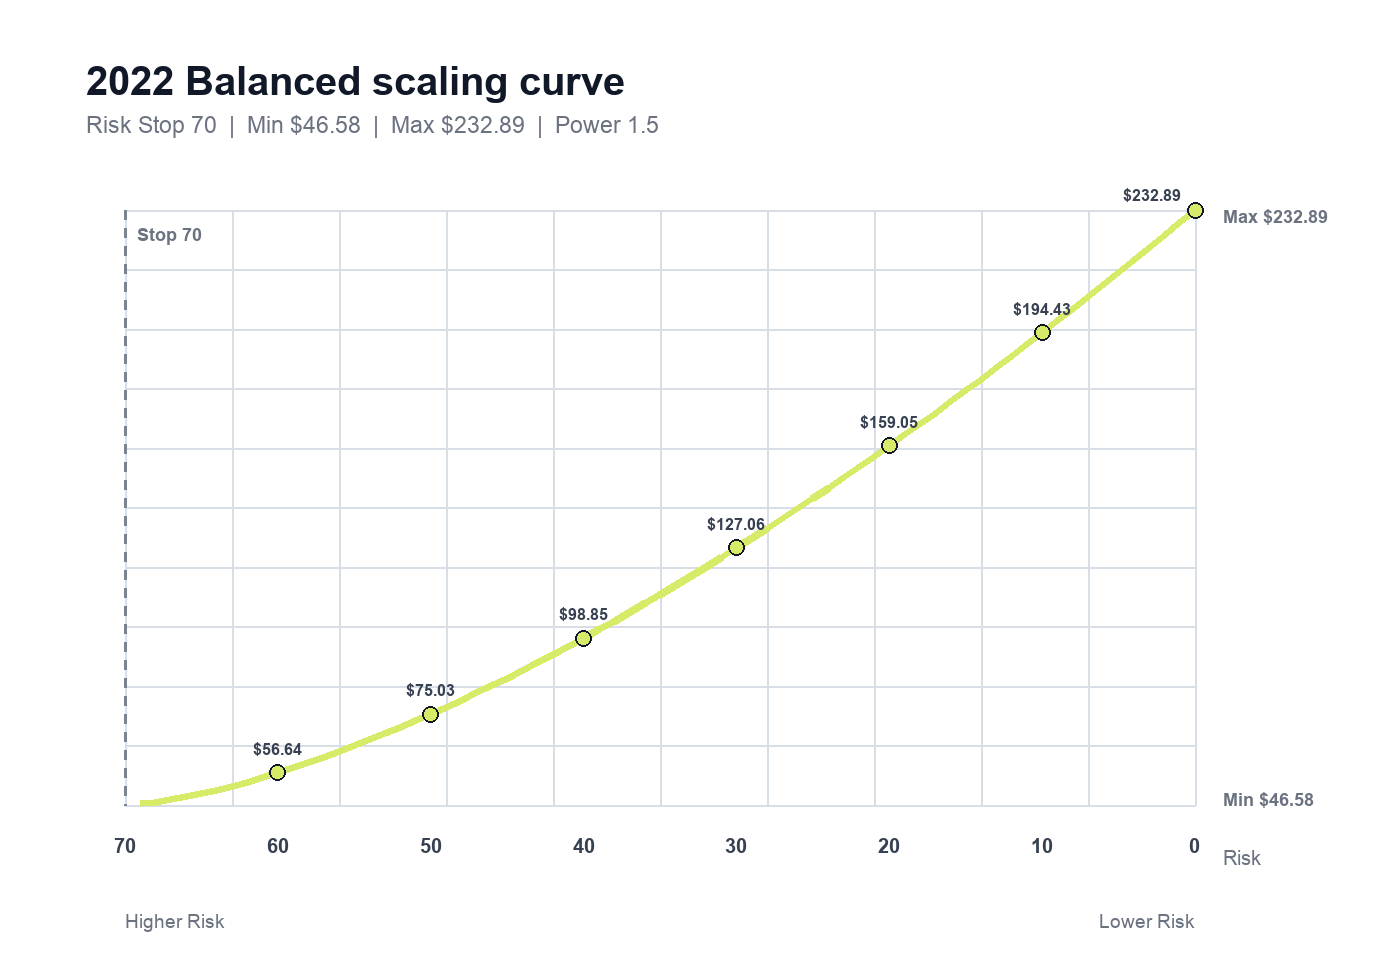
Risk Stop: 70, buy $0 when risk >= 70
Purchase range: Maximum = 5 × minimum
Scaling curve: Balanced - Curve power: 1.5
Both strategies invested the same total dollars. Adaptive changed only when and how much was deployed.

The 2022 Purchases example:
The 2022 recovery is the most recent completed example.
Fixed DCA:
The deployment is 100%. Fixed DCA invested $100 across 164 Fridays, totaling $16,400.
Adaptive Accumulate:
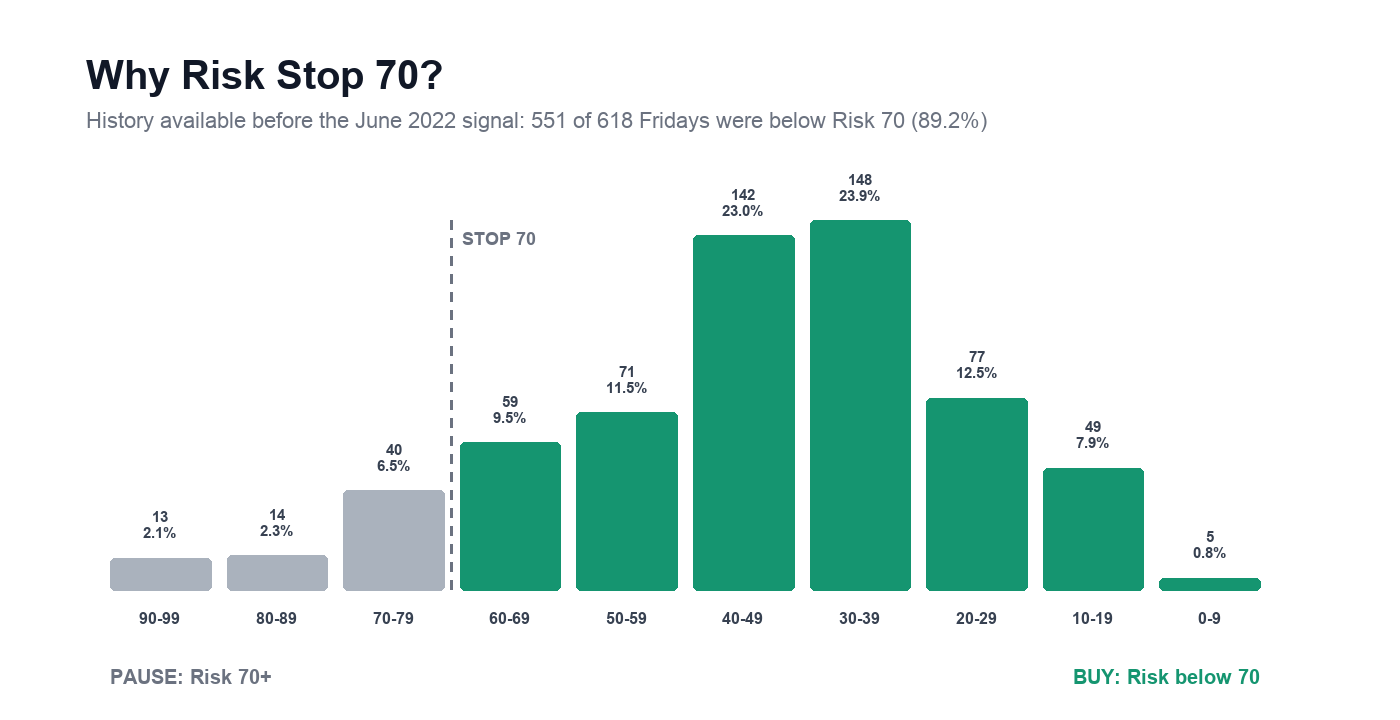
Risk Stop 70 keeps Adaptive active through most market conditions while pausing purchases when the market becomes historically hot. Based only on Friday data available before the June 2022 signal, purchases would have executed 89.2% of the time.
The Balanced curve then controls position size: smaller purchases at moderate Risk and progressively larger purchases as Risk falls. During the following 2022–2025 cycle, the strategy executed on 162 of 164 Fridays (98.8%).
Adaptive did not predict the exact bottom. It shifted the same total capital away from higher-risk weeks and toward lower-risk weeks.
3. The Result: More BTC in Every Completed Window
3.1. Test Result
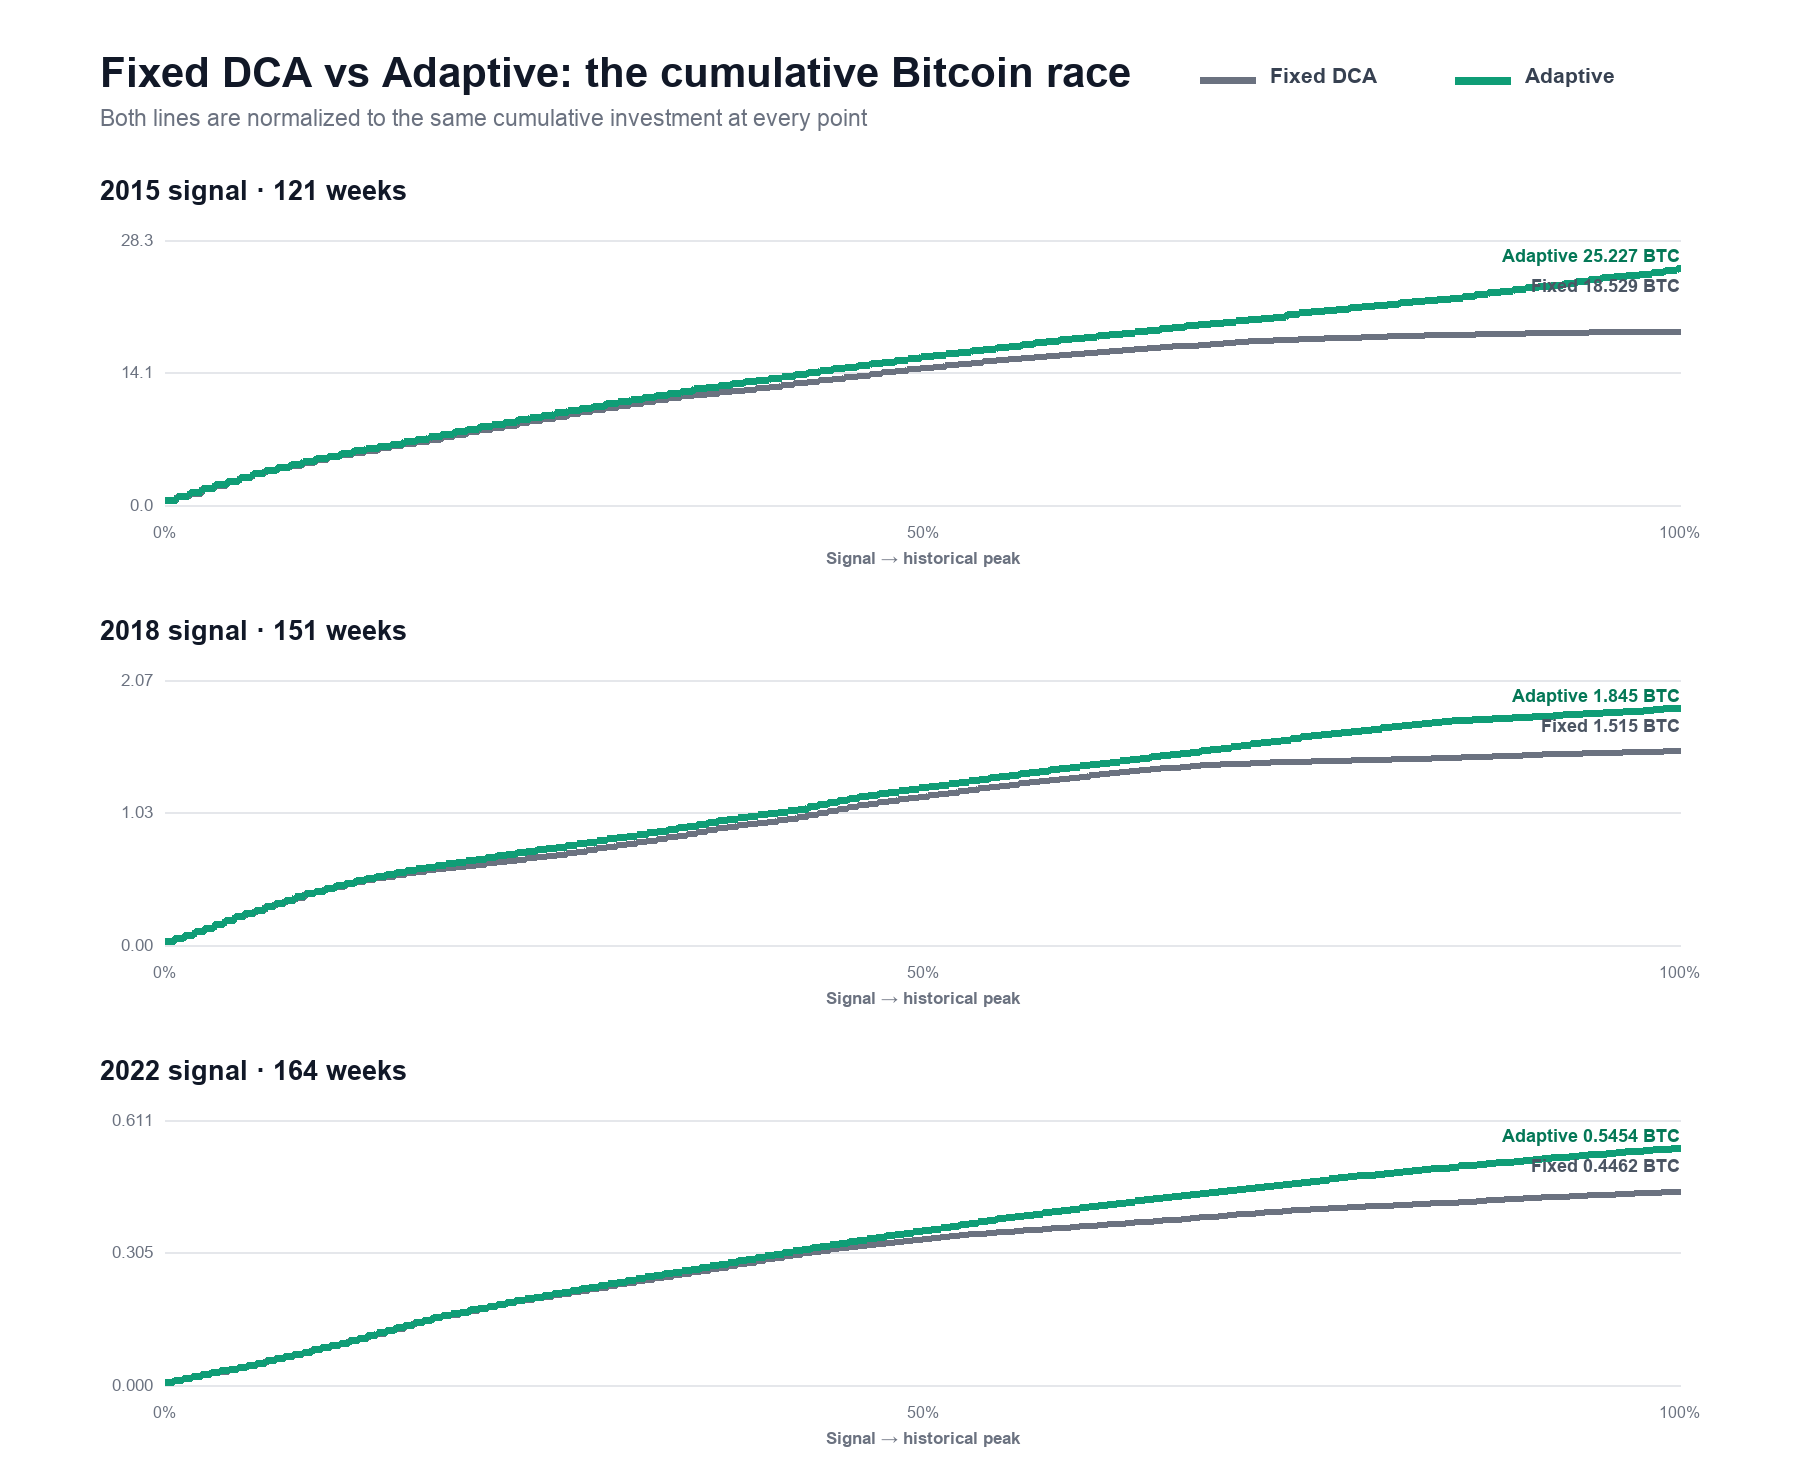

The variation matters as much as the three wins. The two recent completed cycles produced similar improvements of roughly 22%. In 2015, Risk-weighted deployment accumulated 6.6975 additional BTC with the same $12,100 investment.
At each historical peak, more BTC also meant a higher USD value. No cash reserve was included. Both strategies invested the same total dollars and were valued at the same ending Bitcoin price.
3.2. Portfolio Value on Equal Capital
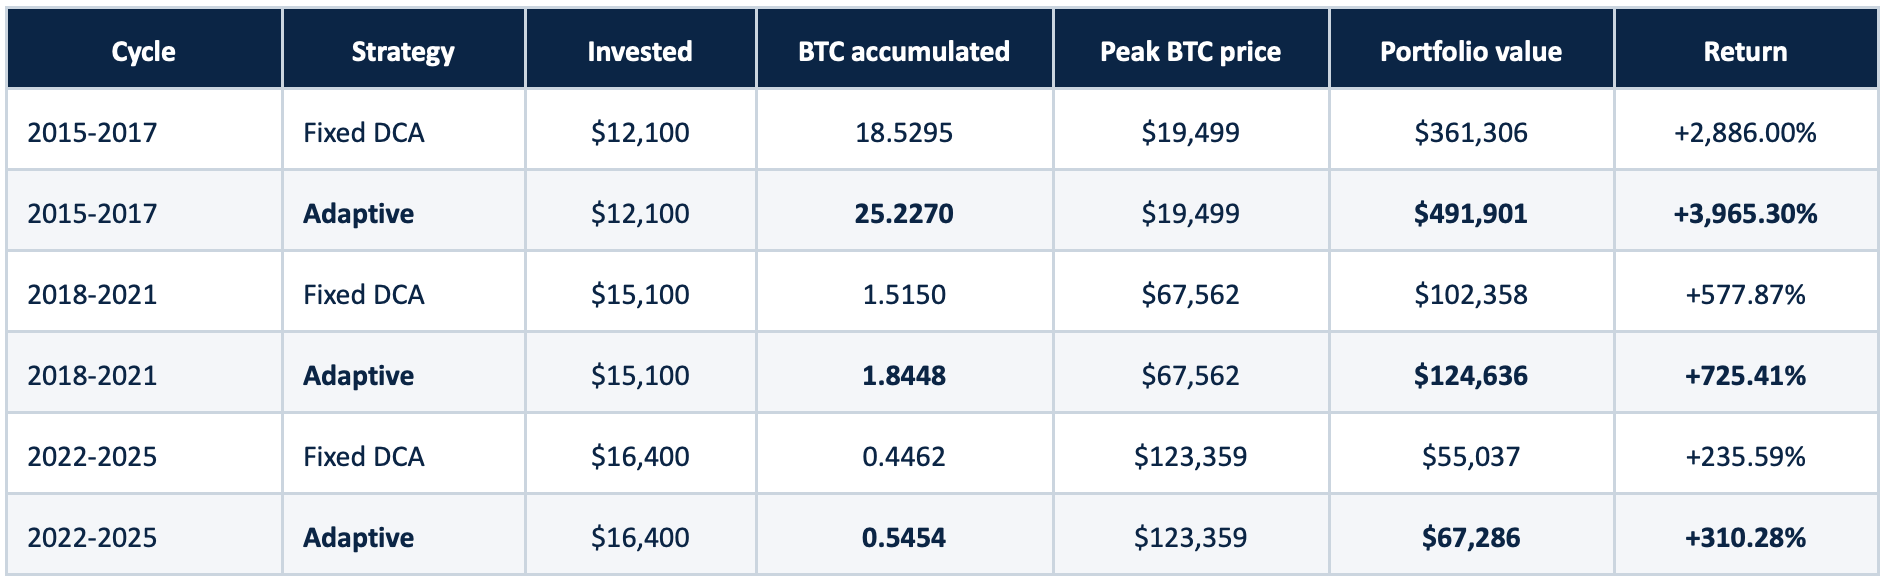
Both strategies invested the same total dollars within each cycle and were valued at the same historical peak price. Adaptive’s higher portfolio value came entirely from accumulating more Bitcoin, not from receiving additional capital or holding reserve cash.
3.3. Diminishing Returns as Bitcoin Matures
Percentage returns declined across successive cycles. As Bitcoin’s market value and liquidity increased, producing the same percentage gain required substantially more new capital. A larger, more mature asset can still appreciate, but repeated exponential expansion becomes progressively harder.
The Adaptive accumulation advantage also narrowed from 36.15% more BTC in 2015 to roughly 22% in the two recent cycles. The relevant result is not that Adaptive preserves Bitcoin’s early-cycle returns. It is that allocating equal capital more heavily during lower-risk periods continued to improve BTC accumulation as total cycle returns moderated. Three completed cycles remain too small a sample to treat this pattern as a permanent law.
4. What Should an Investor Take From This?
Fixed DCA remains the simpler strategy. It requires no Risk model, produces predictable cash flow, and guarantees continuous exposure.
Adaptive asks the investor to accept variable purchases. A $100 average weekly budget historically translated to roughly:
Adaptive minimum ~= fixed budget x 0.5
Adaptive maximum ~= fixed budget x 2.5
For a $100 average budget, that is approximately $50-$250. Some weeks require more than $100; other weeks require less or nothing. The investor must be able to fund that variability. The current 2026 signal is an opportunity to apply a rule, not a reason to assume history will repeat.
KEY TAKEAWAY A Risk score is a sizing reference, not a prophecy. The advantage comes from following the allocation rule through uncertainty, not knowing the future bottom or top.
Methodology
Data was pulled from Hodly’s production backend on July 10, 2026. The source contained 5,777 daily BTC price-and-Risk records from August 16, 2010 through July 9, 2026.
Daily prices were converted to Sunday-ending weekly observations for signal detection. Purchases occurred on Fridays. Missing dates carried forward only the latest previously known price and Risk value. The test excludes fees, spread, slippage, taxes, custody costs, and execution failures.
Three completed first-touch cycles remain a small sample. Historical performance does not predict future results. This article is educational and is not financial, investment, tax, or legal advice.